FF.6 Interpret Dot plots
The dot plot shows restaurant star ratings given by customers. Which statement is true about the data?
Students rated a learning app from 1 to 8 stars. The results are shown in the dot plot. Which list represents the ratings?
Students counted how many jumps they could do in 1 minute. How many students jumped 30 times? students How many students jumped more than 35 times? students How many students were recorded altogether? students
Pokémon cards collected. How many students found 3 or more rare cards? students
A teacher asked students how many books they read last month. The results are shown in the dot plot. How many students read 3 books? students How many students read 5 or more books? students
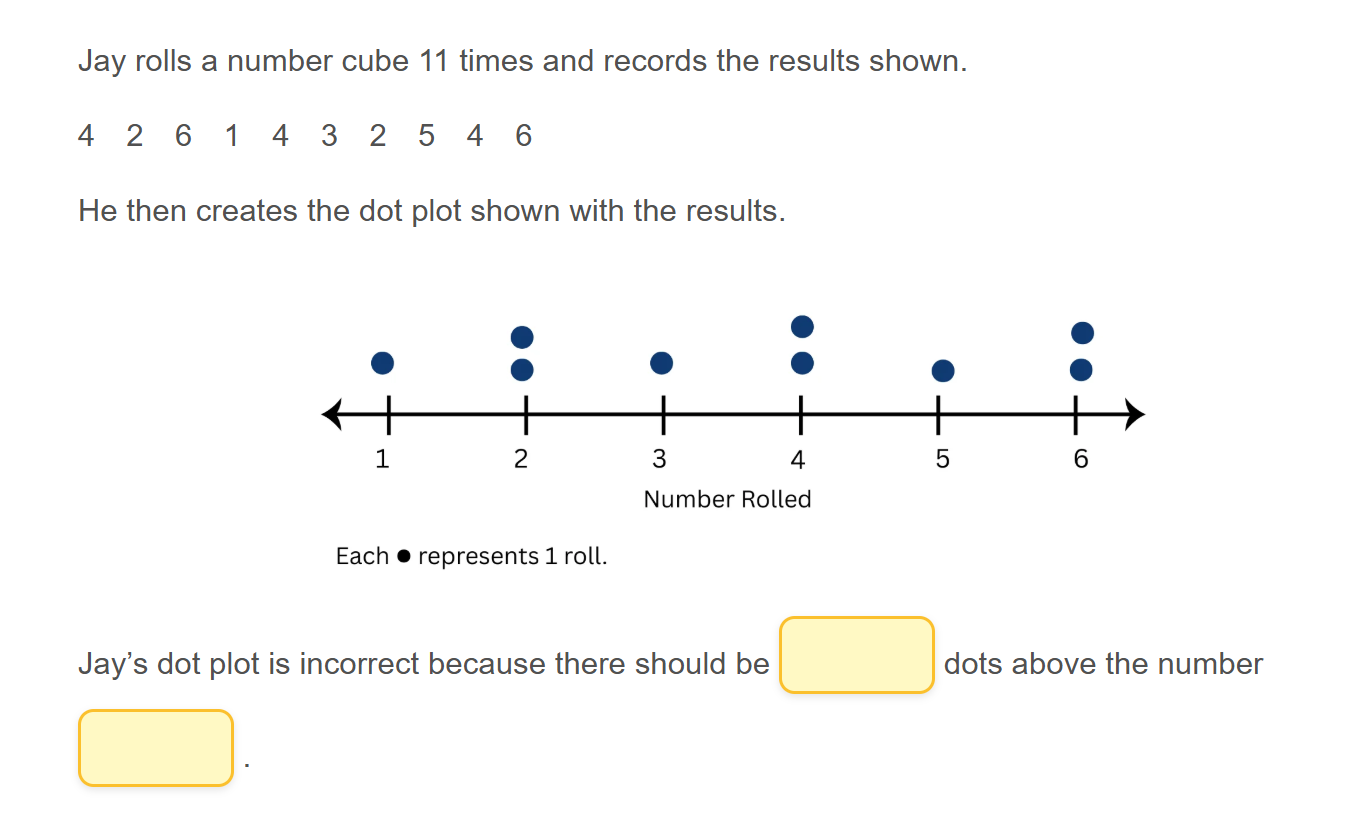
A student rolled a number cube several times. The results are shown in the dot plot. Which list represents the results?
The dot plot shows the number of goals scored in soccer games. How many games had exactly 7 goals scored? games How many games are shown in the dot plot? games How many games had fewer than 6 goals scored? games
A student rolled a die several times during a game. The results are shown in the dot plot. Which list represents the results?
A teacher counted how many apples students packed in their lunch boxes. The results are shown in the dot plot. How many lunch boxes had exactly 4 apples? lunch boxes How many lunch boxes had fewer than 3 apples? lunch boxes
A group of kids shared the highest level they reached in a video game. The results are shown in the dot plot. How many players reached level 5 or higher? players Which level was reached most often? How many players were surveyed? players
Kids built LEGO towers and measured the heights in inches. The results are shown in the dot plot. How many towers were taller than 14 inches? towers
The dot plot shows the lengths of toy cars in inches. How many toy cars were longer than 5 inches?
A class recorded outdoor temperatures for several days. How many days were warmer than 70°F? days How many days were shown on the dot plot? days
Students collected seashells during a beach trip. The results are shown in the dot plot. How many students collected at least 8 seashells? seashells
Your score is
The average score is 66%
Restart quiz